Tutorial Video
Cell and Double Column Vectors
A table consists of a series of Variables (Columns). Let us first create these columns individually.
Names (Cell)
Names={'Simon';'Lisa';'Peter';'John';'Claire';'Ashley'}

class(Names)
Returns a cell.
Test1Results (Double)
Test1Results=[62;73;73;73;55;44]
![\displaystyle \text{Test1Results}=\left[ {\begin{array}{*{20}{c}} {85} \\ {73} \\ {73} \\ {73} \\ {55} \\ {64} \end{array}} \right]](https://s0.wp.com/latex.php?latex=%5Cdisplaystyle+%5Ctext%7BTest1Results%7D%3D%5Cleft%5B+%7B%5Cbegin%7Barray%7D%7B%2A%7B20%7D%7Bc%7D%7D+%7B85%7D+%5C%5C+%7B73%7D+%5C%5C+%7B73%7D+%5C%5C+%7B73%7D+%5C%5C+%7B55%7D+%5C%5C+%7B64%7D+%5Cend%7Barray%7D%7D+%5Cright%5D&bg=ffffff&fg=000000&s=0&c=20201002)
class(Test1Results)
Returns a double meaning each number is stored using 64 bits.
Test2Results
Test2Results=[62;74;75;74;55;45]
![\displaystyle \text{Test2Results}=\left[ {\begin{array}{*{20}{c}} {62} \\ {74} \\ {75} \\ {74} \\ {95} \\ {77} \end{array}} \right]](https://s0.wp.com/latex.php?latex=%5Cdisplaystyle+%5Ctext%7BTest2Results%7D%3D%5Cleft%5B+%7B%5Cbegin%7Barray%7D%7B%2A%7B20%7D%7Bc%7D%7D+%7B62%7D+%5C%5C+%7B74%7D+%5C%5C+%7B75%7D+%5C%5C+%7B74%7D+%5C%5C+%7B95%7D+%5C%5C+%7B77%7D+%5Cend%7Barray%7D%7D+%5Cright%5D&bg=ffffff&fg=000000&s=0&c=20201002)
class(Test2Results)
Returns a double meaning each number is stored using 64 bits.
Test3Results
Test3Results=[63;77;77;83;56;40]
![\displaystyle \text{Test3Results}=\left[ {\begin{array}{*{20}{c}} {85} \\ {77} \\ {77} \\ {83} \\ {90} \\ {67} \end{array}} \right]](https://s0.wp.com/latex.php?latex=%5Cdisplaystyle+%5Ctext%7BTest3Results%7D%3D%5Cleft%5B+%7B%5Cbegin%7Barray%7D%7B%2A%7B20%7D%7Bc%7D%7D+%7B85%7D+%5C%5C+%7B77%7D+%5C%5C+%7B77%7D+%5C%5C+%7B83%7D+%5C%5C+%7B90%7D+%5C%5C+%7B67%7D+%5Cend%7Barray%7D%7D+%5Cright%5D&bg=ffffff&fg=000000&s=0&c=20201002)
class(Test3Results)
Returns a double meaning each number is stored using 64 bits.
DateEnrolled
DateEnrolled={'11/01/2019';'21/01/2019';'15/01/2019';'17/01/2019';'22/01/2019';'24/01/2019'}
![\displaystyle \text{DateEnrolled}=\left[ {\begin{array}{*{20}{c}} {11/01/2019} \\ {21/01/2019} \\ {15/01/2019} \\ {17/01/2019} \\ {22/01/2019} \\ {24/01/2019} \end{array}} \right]](https://s0.wp.com/latex.php?latex=%5Cdisplaystyle+%5Ctext%7BDateEnrolled%7D%3D%5Cleft%5B+%7B%5Cbegin%7Barray%7D%7B%2A%7B20%7D%7Bc%7D%7D+%7B11%2F01%2F2019%7D+%5C%5C+%7B21%2F01%2F2019%7D+%5C%5C+%7B15%2F01%2F2019%7D+%5C%5C+%7B17%2F01%2F2019%7D+%5C%5C+%7B22%2F01%2F2019%7D+%5C%5C+%7B24%2F01%2F2019%7D+%5Cend%7Barray%7D%7D+%5Cright%5D&bg=ffffff&fg=000000&s=0&c=20201002)
class(DateEnrolled)
Returns a cell. Although this is in a date time format, it is input as a Cell Array (this will be amended later).
Creating a Table
You'll notice that we have created:
- Names (6 by 1 Cell)
- Test1Results (6 by 1 Double)
- Test2Results (6 by 1 Double)
- Test3Results (6 by 1 Double)
- DateEnrolled (6 by 1 Cell)
As these have an equal number of Rows (6) we can create a Table using these variables:
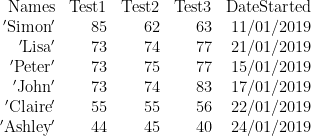
DataTable=table(Names,Test1Results,Test2Results,Test3Results,DateEnrolled)

Looking Up Properties
We can use dot indexing to lookup the table Properties. To the left hand side we have the Table Name we want to lookup and to the right hand side we have the Properties:
DataTable.Properties
If we want to lookup the Variable Names we can use:
DataTable.Properties.VariableNames
The output is a Cell Array. If we want to update it we can type in the following:
DataTable.Properties.VariableNames={'Names','Test1','Test2','Test3','DateStarted'}
Selecting a Variable (Column)
In a Table, each Variable becomes a Column. The above Table therefore consists of 5 Variables which can be accessed using dot indexing:
DataTable.Names
DataTable.Test1
DataTable.Test2
DataTable.Test3
DataTable.DateStarted
Sorting by Value
Let's sort DataTable alphabetically by the Variable 'Names'
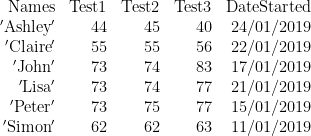
DataTable=sortrows(DataTable,'Names','ascend')
Here we are updating DataTable so it is used both as an input and output of the function sortrows. The second input is the input which we will use to sort the results and the third input is the direction we wish to sort the results out by, in this case we will sort alphabetically with A at the Top and Z at the bottom so we will use 'ascend'
Show this using MATLABs what you see is what you get interface.
Let's first create a new table DataTable2 which sorts the data by three layers the first layer being the value of Test1, the second being the value of Test2 and the third being the value of Test3. If one was using Excel, they would use Sort with the drop downs below.

In MATLAB we can use the sortrows function again but this time with a cell array as the first input. This time we will create a new table as the output:
DataTable2=sortrows(DataTable,{'Test1','Test2','Test3'},'descend')

Operating on a Variable (Column)
The last column is a series of strings but we want them to be dates, we can convert them to dates using the function datetime
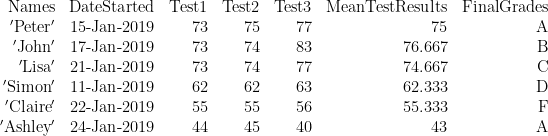
DataTable2.DateStarted=datetime(DataTable2.DateStarted)

Adding a Column to the Table
Supposing we want to calculate the average of the three tests and add it to a Column at the end of the table:
DataTable2.MeanTestResults=mean([DataTable2.Test1,DataTable2.Test2,DataTable2.Test3],2)
The first input of the function mean is the three Variables selected using dot indexing [DataTable2.Test1,DataTable2.Test2,DataTable2.Test3] and the second input is the direction 2 meaning we act on Rows opposed to Columns.
The output is a new column DataTable2.MeanTestResults which by default is added to the end of the Table.

Rearranging Variables (Columns)
Assuming we want the DateStarted to be the second column opposed to the last. We can rearrange the Variables and save the output to a new table using the Variable (column) numbers. The first input being : meaning all rows are selected and the second input being the reordered variable (column) numbers
DataTable3=DataTable2(:,[1,5,2,3,4,6])

We can also rearrange the Variables and save the output to a new table using the Variable (column) names. Once again the first input being : meaning all rows are selected and the second input being the reordered variable (column) names as a cell array
DataTable4=DataTable2(:,{'Names','DateStarted','Test1','Test2','Test3','MeanTestResults'})
Categorical Variable (Column)
DataTable4.FinalGrades={'A';'B';'C';'D';'E';'A'}

DataTable4.FinalGrades=categorical(DataTable4.FinalGrades)
Supposing we are interested in those who have a Grade 'A'then we can created a Variable:
Aselect={'A'}

In order to use it with the Categorical Column, it itself must be Categorical:
Aselect=categorical(Aselect)

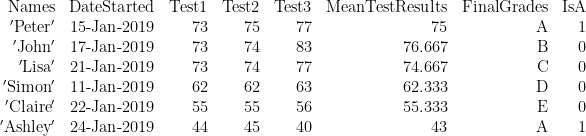
Now we can construct a Column Vector which will be 1 (true) when DataTable4.FinalGrades==ASelect and 0 (false) when DataTable4.FinalGrades~=ASelect
LogicalRowSelect=DataTable4.FinalGrades==Aselect
![\displaystyle \text{LogicalRowSelect}=\left[ {\begin{array}{*{20}{r}} 1 \\ 0 \\ 0 \\ 0 \\ 0 \\ 1 \end{array}} \right]](https://s0.wp.com/latex.php?latex=%5Cdisplaystyle+%5Ctext%7BLogicalRowSelect%7D%3D%5Cleft%5B+%7B%5Cbegin%7Barray%7D%7B%2A%7B20%7D%7Br%7D%7D+1+%5C%5C+0+%5C%5C+0+%5C%5C+0+%5C%5C+0+%5C%5C+1+%5Cend%7Barray%7D%7D+%5Cright%5D&bg=ffffff&fg=000000&s=0&c=20201002)
We can then use this to Logically select the Rows where the DataTable4.FinalGrades are 'A' and all Variables (Columns):
DataTableA=DataTable4(LogicalRowSelect,:)

Supposing instead we want to add this as an additional Column to DataTable4:
DataTable4.IsA=LogicalRowSelect
Class of Variable (Column)
We can now check the class of each Variables:
class(DataTable4.Names)
cell
class(DataTable4.Test1)
double
class(DataTable4.Test2)
double
class(DataTable4.Test3)
double
class(DataTable4.MeanTestResults)
double
class(DataTable4.DateStarted)
datetime
class(DataTable4.FinalGrades)
categorical
class(DataTable4.IsA)
logical
Categorical Variable (Column) Dependent on Criteria
And supposing we have the following criteria:

Note that there are 5 Grades and 6 Levels (number of Grades plus 1) because each Grade has a lower and upper limit
Levels=[0;50;55;70;80;100]
Grades={'F';'D';'C';'B';'A'}
We can specify the FinalGrades as a categorical Array of the Grades which correspond to the Levels in the MeanTestResults.
DataTable4.FinalGrades=discretize(DataTable4.MeanTestResults,Levels,'categorical',Grades)

Removing a Variable (Column) from a Table
Since the Logical Column IsA, no longer makes sense we can remove it using:
DataTable4.IsA=[]

Merging Categories
Supposing Grades A, B and C correspond to a Pass and Grades D and F correspond to a Fail. We can use the Merge Categories Column to:
Creates a New Column from the merged categories:
DataTable4.Status=mergecats(DataTable4.FinalGrades,{'A','B','C'},'Pass')
Merges the remaining categories:
DataTable4.Status=mergecats(DataTable4.Status,{'D','F'},'Fail')
Note the line would update the values 'Pass' withe the corresponding 'A', 'B' and 'C' values:
DataTable4.Status=mergecats(DataTable4.FinalGrades,{'D','F'},'Fail')

