Angles
Degrees
The circumference of a circle is equal to:

Where the constant, in decimal format is equal to:

To specify the length of an arc (fraction of a circle in degrees) we would use:
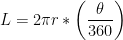
The degree is an arbitrary unit and divides the circle into 360 equally spaced angles or the right angle into 90 equally spaced angles.
Gradians
The gradian on the other hand was an attempt to make a "metric degree". It is another arbitrary unit that divides the circle into 400 equally spaced angles and right angle into 100 equally spaced units. The length of an arc would become in gradians:
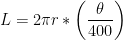
This unit was never widely adopted.
Radians
The above is quite messy in decimal format so another unit of measurement is commonly used to simplify the above, the radian.
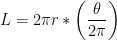
For the radian, there are 2π radians in a circle and 2π/4 or π/2 radians in a right angle. The above hence simplifies to:

This means the length of the arc is equal to the product of the radius and the angle.
Conversions
To convert from radians to degrees use:
To convert from degrees to radians use:
All angles from now on will be in radians unless specified.
Co-ordinate Systems
Cartesian Co-ordinates (x,y)
Normally we specify a point in a line in Cartesian co-ordinates. For Cartesian Co-ordinates, we first specify a length in x corresponding to the distance from the x-axis.


Polar-Co-ordinates (r, θ)
You'll notice the x,y co-ordinate we specified above is a Pythagorean triple. We can plot this out on square axes and have a look at its properties.

We can measure the length of r and the angle θ using a ruler and a protractor. Or alternatively we can calculate them. We know that:


We also know:
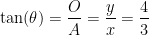
theta=53.13 °
Alternatively in Radians
theta=0.9273
With the r and θ information we have all the information we need to construct the co-ordinate.


Conversions
To convert from Cartesian to Polar use:
To convert from Polar to Cartesian use:
Plotting
Let us compute a number of values on a circle of radius 1, convert these into Cartesian and then plot:
This gives:

We can modify the code so the radius varies for each point:
This gives:

Plot
Let's plot the equation:
This gives us:

In this case the x-axis is θ shown in radians and the y-axis is r.
Polar Plot
Recall that a circle is cyclical and 2π returns one back to the starting point. We can take advantage of this and use a polar plot. A polar plot in essence turns the above plot into the form of a dart board. Every point is drawn in accordance to its radius at an angle θ.
In MATLAB we can plot using θ and r. The functions:
Have the same form as:
Except we use plot using polar co-ordinates θ and r opposed to Cartesian co-ordinates x and y. Let's re-create the plot above as a polar plot:
Note for some reason by default MATLAB requires the input for a polar plot to be specified in radians and by default displays the output in degrees. This can cause some confusion when first using this plot. I have therefore added a line to get the current axis and to change the axis to Radians.

Here one can clearly see the cyclic nature of the circle and how the function repeats itself as one goes round the circle again.
θ,r vs x,y
When looking at Polar Plots for the first time. One may get the following confused:

With:
Note the sine function relates r to θ and not y to x. We can see what
This plot shows:

This can also be made into a Polar Plot:

Conversely we can convert 

As a Polar Plot:

